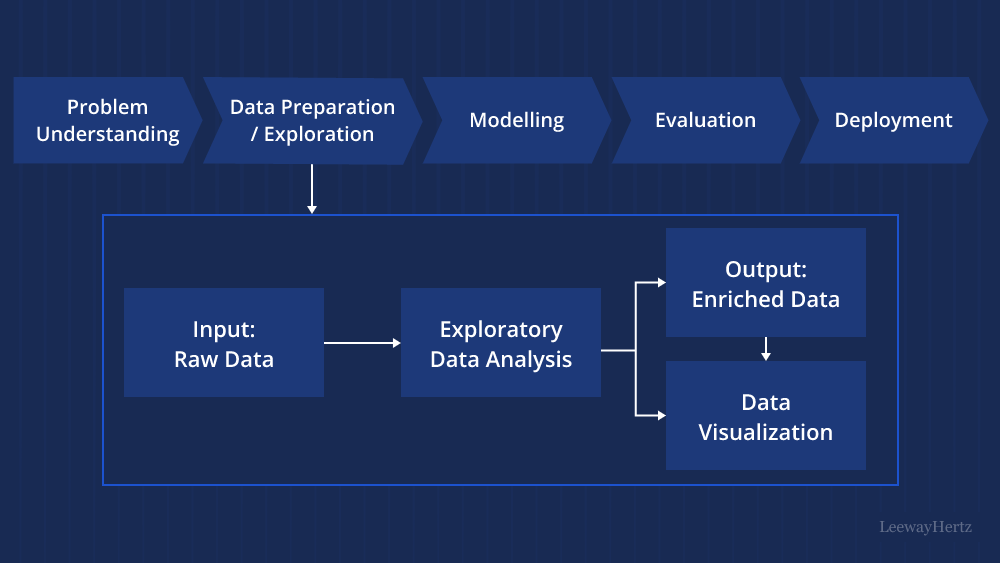
Exploratory Data Analysis (EDA) is a fundamental and essential step in the data analysis process. It serves as the first line of investigation into a dataset, enabling data scientists and analysts to understand the underlying patterns, relationships, and distributions within the data. EDA involves a set of methods and techniques that help unravel valuable insights, detect outliers, and identify potential data issues. In this article, we will explore the concept of Exploratory Data Analysis and some of the common methods and techniques employed in this critical data exploration process.
The Purpose of Exploratory Data Analysis
The primary goal of EDA is to comprehend the structure and content of the dataset. By visually inspecting and summarizing the data, analysts can obtain a comprehensive overview before proceeding with more advanced analyses or modeling. EDA helps to identify the following:
- Data Distribution: EDA helps to understand the distribution of each variable in the dataset. It reveals whether the data follows a normal distribution, is skewed, or exhibits other patterns.
- Missing Values: EDA enables the detection of missing or incomplete data, which is crucial for data cleaning and imputation before any further analysis.
- Outliers: Outliers are extreme values that deviate significantly from the rest of the data. EDA helps to spot such anomalies, which could have a significant impact on the analysis if not handled appropriately.
- Correlations: EDA helps to uncover relationships between variables, providing insights into potential cause-and-effect associations or dependencies.
- Data Quality Issues: Exploring the data helps in identifying inconsistencies, errors, or irregularities, thus ensuring data quality and integrity.
Common Methods and Techniques in Exploratory Data Analysis
- Summary Statistics: Summary statistics such as mean, median, mode, standard deviation, and quartiles provide a quick overview of the central tendency, spread, and shape of the data distribution.
- Data Visualization: Data visualization is a powerful tool in EDA. Techniques like histograms, box plots, scatter plots, line plots, and heatmaps help represent data visually and identify patterns, clusters, and outliers.
- Correlation Analysis: Correlation analysis, often presented through correlation matrices or heatmaps, helps to understand the strength and direction of relationships between variables.
- Distribution Analysis: Probability plots and density plots aid in assessing whether the data follows a specific distribution, such as the normal distribution.
- Outlier Detection: Techniques like the z-score method or the Interquartile Range (IQR) method help identify potential outliers in the data.
- Missing Data Imputation: For datasets with missing values, EDA can be used to assess the extent of missingness and decide on appropriate imputation methods.
- Data Transformation: EDA may reveal skewed data that can benefit from transformations like logarithmic, exponential, or power transformations to achieve a more symmetrical distribution.
- Segmentation and Clustering: Techniques like k-means clustering or hierarchical clustering can help identify natural groupings within the data.
- Time Series Analysis: For time-dependent data, time series analysis methods like autocorrelation plots and seasonal decomposition are useful in understanding underlying temporal patterns.
- Geospatial Analysis: When dealing with geographical data, geospatial analysis techniques like choropleth maps or spatial autocorrelation can reveal spatial patterns and relationships.
Conclusion
Exploratory Data Analysis (EDA) is a critical step in the data analysis process, providing invaluable insights into the structure and characteristics of the dataset. By employing various methods and techniques like summary statistics, data visualization, correlation analysis, and outlier detection, data scientists and analysts can gain a deeper understanding of the data before proceeding with more advanced analyses or modeling. EDA helps in making informed decisions regarding data quality, preprocessing, and subsequent analyses, ultimately leading to more accurate and meaningful results in any data-driven project.
To Learn More:- https://www.leewayhertz.com/what-is-exploratory-data-analysis/

Leave a comment